Deep Dive · Issue 13
Why Your Optimization Might Just Be Reshuffling the Cache
Your speedup might be moving the bottleneck around the memory hierarchy instead of removing it.

Two different bills
Counting work, ignoring traffic
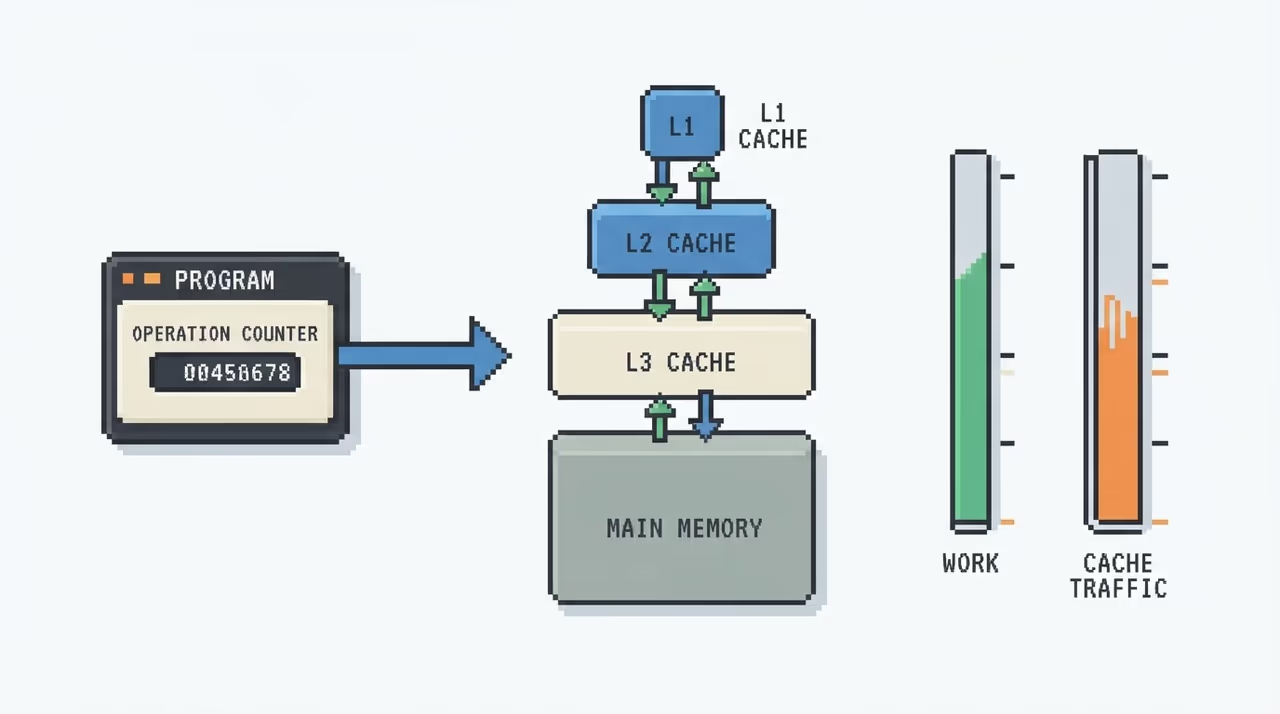
Sweep every element of an int array and it takes about 80ms. Now touch only every 16th element, roughly 6% of the operations, and it takes 78ms. Almost no change, even though you cut the work by a factor of 16. Both loops walk the same set of 64-byte cache lines, and it is the line fetches, not the operations, that the machine is paying for.
Classical Big-O counts work: instructions and operations on an idealized RAM. The ideal-cache model adds a second, formally separate quantity, the cache complexity Q(n; Z, L), the number of cache-line transfers for a cache of size Z and line length L. Minimizing one does not minimize the other, so an optimization that shrinks the operation count can leave the traffic bill untouched.
Work W(n)
operations, RAM model
Cache Q(n;Z,L)
cache-line transfers
This is the trap the whole article is about. When you "optimize" without saying which cache resource you improved, you may just be moving cost from one line of the ledger to the other, or from one level of the hierarchy to another.
Granularity
Cache lines arrive in bulk
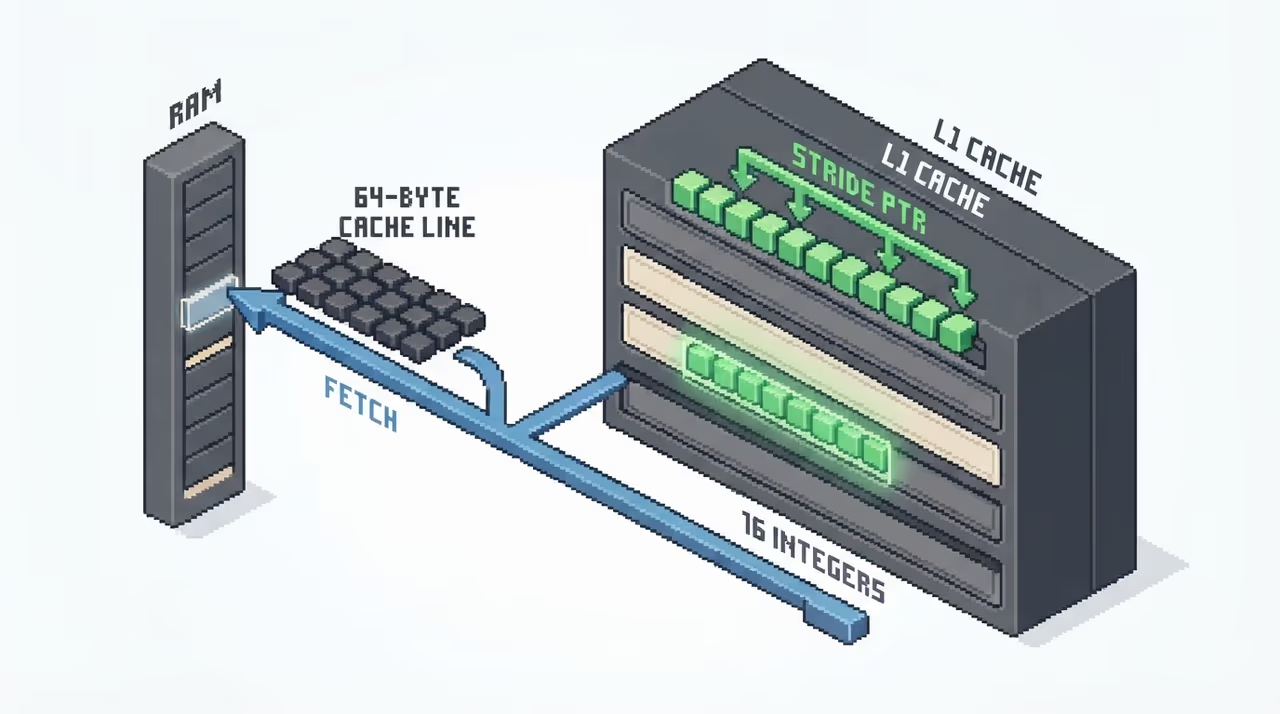
Step through an int array with stride K and the runtime stays flat for K = 1 through 16, then halves every time you double K past that. The reason is arithmetic: 16 ints is exactly 64 bytes, one cache line. Skipping elements inside a line buys nothing, because the whole line comes along regardless.
stride   L1D store misses  (Apple M1 Max, 128B line)
   1        315
   4        777
  16       1517
  64       4228
 128       6447   <- one full line's worth
 256       6739   (plateau)
The same shape shows up on modern ARM hardware. On an M1 Max with a 128-byte line, store misses climb 315 → 777 → 1517 → 4228 → 6447 as the stride grows, then flatten at stride 128 once each access already lands on its own line. Below that boundary the extra prefetched bytes are effectively free.
Fewer accesses and fewer misses are not the same number, and only one of them shows up on the clock.
Associativity
It fits in cache and still thrashes
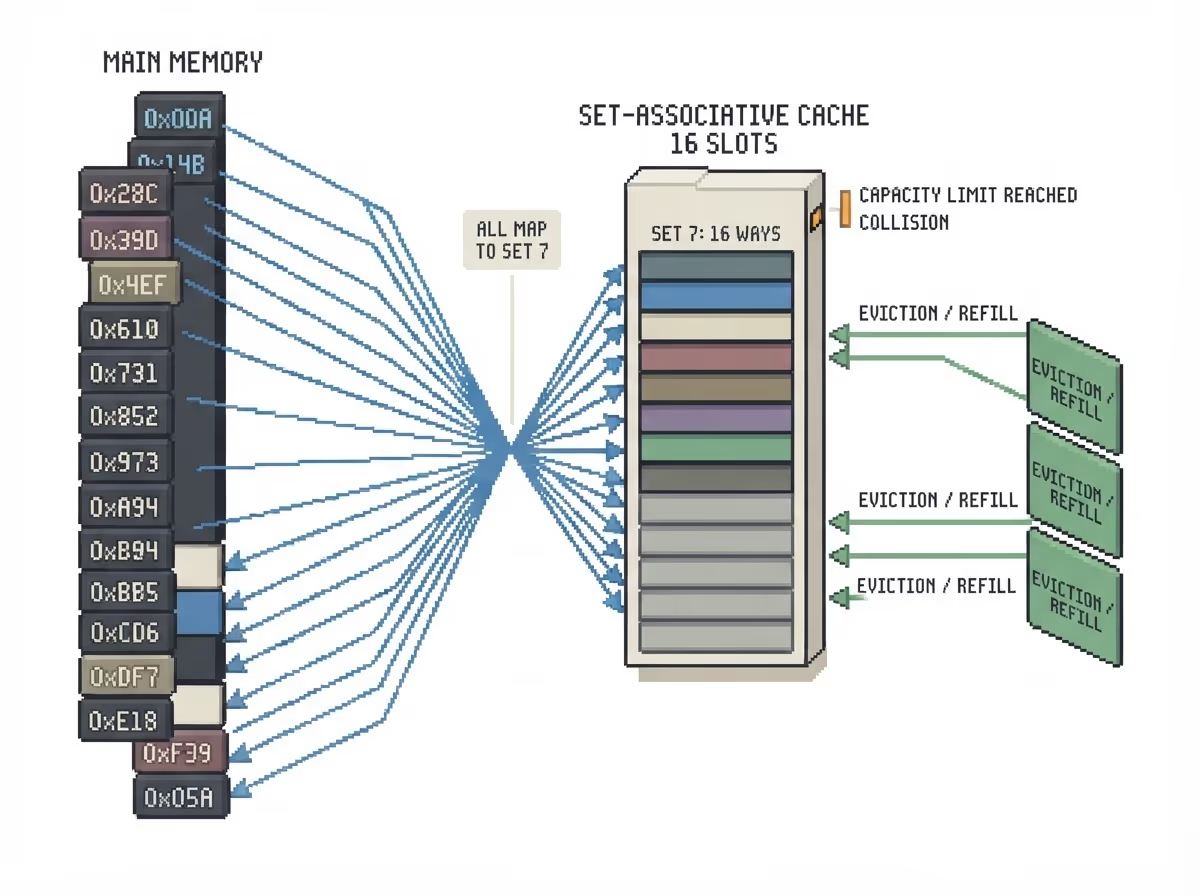
A 4MB L2 that is 16-way set associative has 4096 sets. That means addresses 262,144 bytes apart (4096 × 64) map to the same set and compete for just 16 slots. Walk memory with a power-of-two stride and you can touch more than 16 of those colliding lines while your actual working set is far smaller than 4MB.
4 MB L2  |  16-way  |  4096 sets  |  64B lines

  addr A          ┐
  addr A+256KB    │  17+ lines,
  addr A+512KB    ├  all mapping to
  addr A+768KB    │  the same set...
     ...          ┘  ...16 slots.

working set fits in 4 MB -> still thrashesThe data was small enough for the cache the whole time. The access pattern converted capacity headroom into conflict misses, a different cause with the same visible symptom. Tuning a stride or padding a struct "to fit the cache" without accounting for associativity just relabels where the misses come from.
GPU stalls
Fixing one stall by creating another
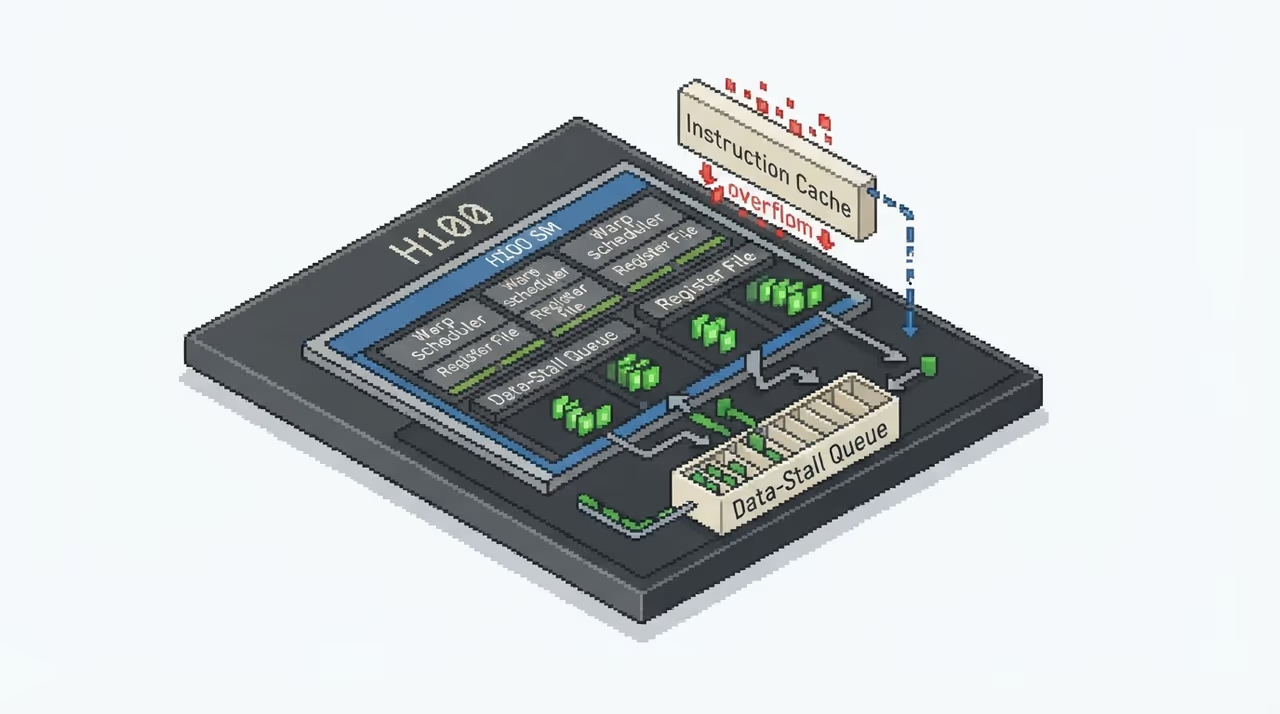
NVIDIA hit this on an H100 running a Smith-Waterman genomics kernel. Scaling the workload from 1x to 4x subproblems, which should improve occupancy, made it slower. Warps in a block drift out of lockstep over time, so the number of distinct live instructions on an SM grows with the workload and overflows the instruction cache, a miss category their new Nsight counters made visible.
Long Scoreboard (data stalls ↓)No Instruction (icache stalls ↑)
Unrolling drains one queue and fills the other.
The optimization under test was loop unrolling, the textbook way to cut data stalls and improve instruction-level parallelism. It did reduce data stalls and raise icache stalls, worse as the workload grew. The sweet spot was no unrolling on the outer loop and a factor of 2 on the inner one, and dialing unrolling back down then raised per-thread register usage, capping occupancy. The bottleneck kept moving between three resources without ever leaving the SM.
Coherence
Packing tighter, paying in coherence
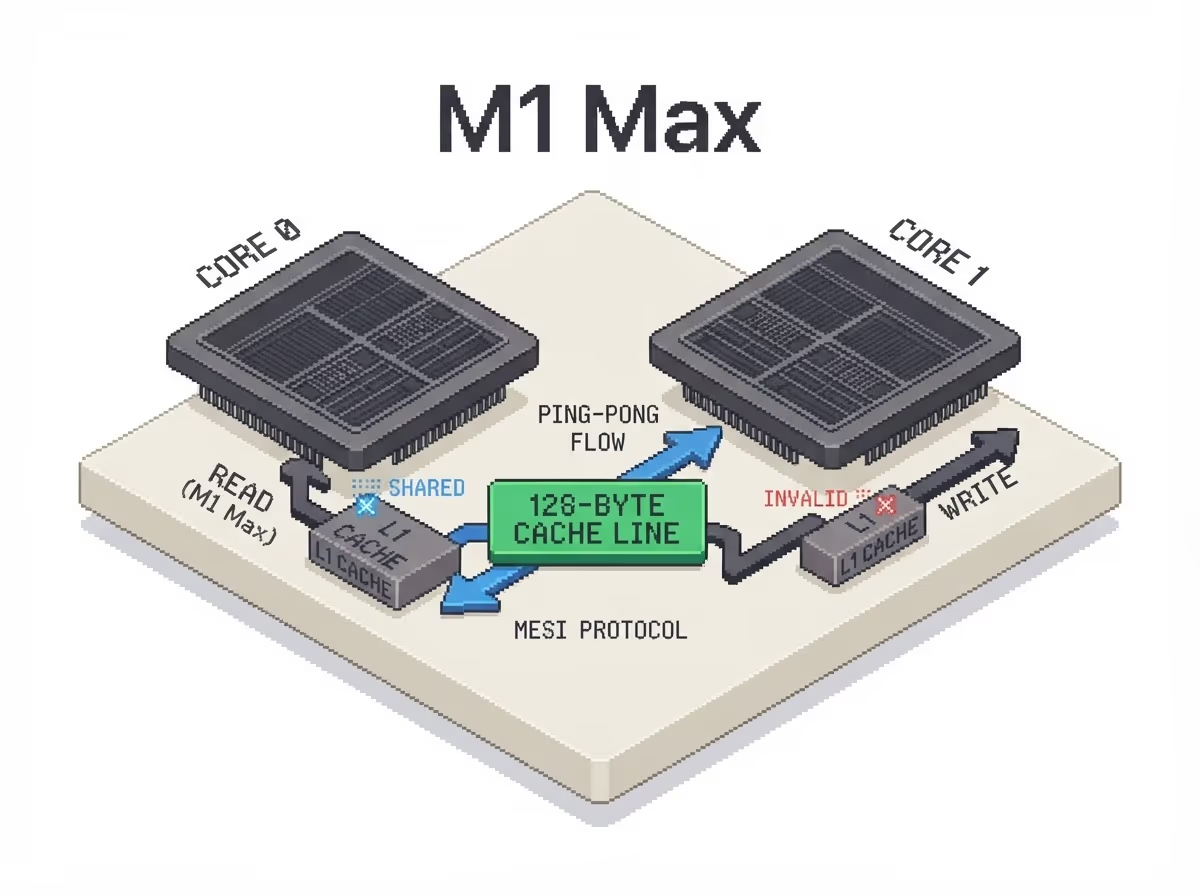
On an M1 Max with a 128-byte line, two atomics padded onto separate lines scale roughly linearly with thread count, the expected contention. Pack those same variables onto one shared line and latency jumps by an order of magnitude. Every write from one core invalidates the line in the other core's L1, so the two caches ping-pong the line through MESI.
Padded
one line each, linear scaling
Packed
shared line, ~10x latency
Tight packing to save memory looks like a locality win, and it converts capacity pressure into coherence traffic. The misses did not vanish. They changed cores and changed cause, from your own cache being too small to another core stealing your line out from under you.
The theory
Which cache did you actually optimize?
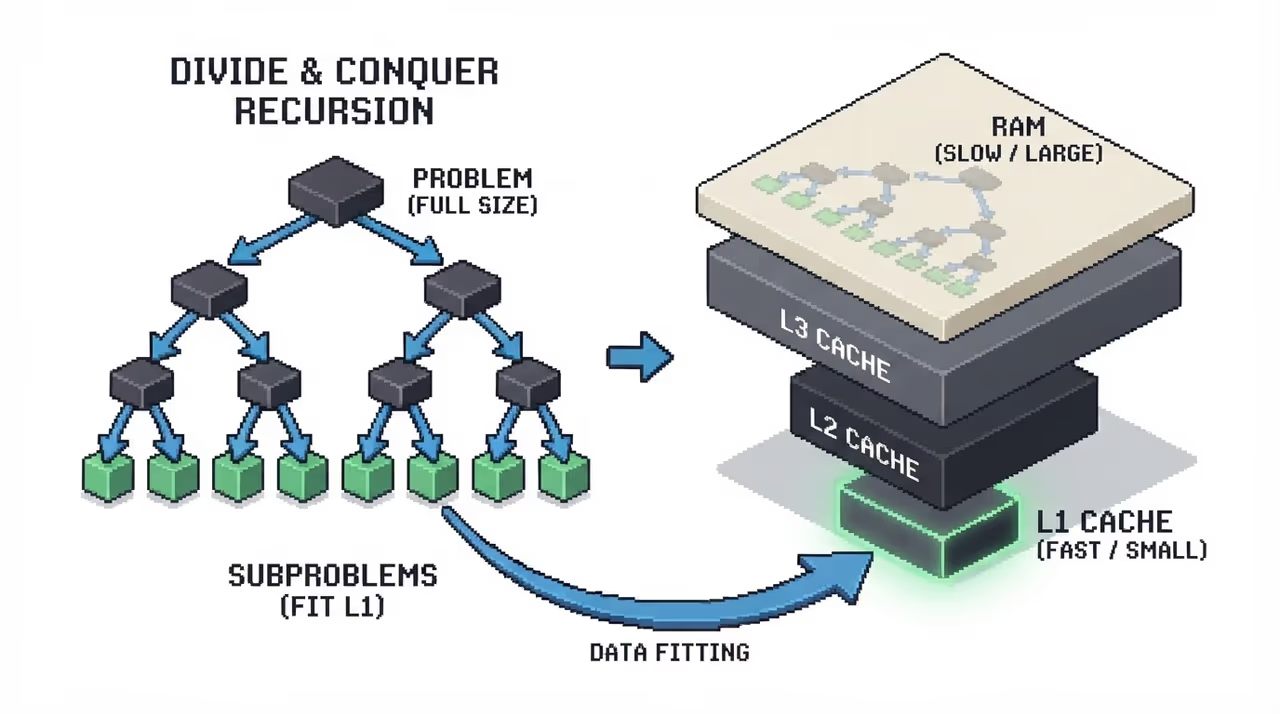
The ideal-cache model has a clean theorem: a cache-oblivious algorithm that is optimal for two levels of memory is automatically optimal for any number of levels, because it recurses until subproblems fit whatever cache actually exists. The converse is the engineering warning. An algorithm hand-tuned to one specific level, say L2, carries no such guarantee and can be great there and bad at L1 or L3.
Parallelizing can quietly reshuffle cost into depth. Naively running the two recursive calls of an optimal cache-oblivious mergesort in parallel yields O((n/L)·log(n/Z)) misses, provably worse than the optimal O((n/L)·log_Z n), and recovering optimality with low depth needed a structurally different sample-sort, not retuned constants.
And the theoretically optimal structure does not always win. On priority queues that fit in RAM, cache-oblivious implementations lost to both cache-aware and plain RAM-model ones, only pulling ahead once data spilled past main memory, while being harder to implement. Sometimes the effort gets reshuffled and the miss profile does not improve at all.
The takeaway
Measure the resource, not the op count
Why it matters
Performance on modern machines is set by data movement across a memory hierarchy, yet most optimization instincts still target operation counts. That mismatch is why so many "speedups" relocate the bottleneck instead of removing it: from data cache to instruction cache, from capacity to conflict, from one core's cache to coherence traffic. Before claiming a win, profile which cache resource and which level actually changed, because the op count and the wall clock frequently disagree.
The short version
- Work and **cache complexity** `Q(n;Z,L)` are separate costs; cutting operations often leaves line transfers unchanged.
- Cache-line granularity means skipping elements is free until the skip crosses a line, so fewer accesses need not mean fewer misses.
- Optimizations regularly move the stall rather than remove it: data cache to icache, capacity to conflict, capacity to coherence.
- An algorithm tuned to one cache level has no guarantee at another; only cache-oblivious optimality transfers across all levels.
- Parallelizing a cache-optimal algorithm can add depth-dependent misses unless the algorithm is redesigned, not just retuned.
Sources
- 1.Cache-Oblivious Algorithms
- 3.Brief announcement: low depth cache-oblivious sorting
- 4.Cache-oblivious algorithm - Wikipedia
- 6.GitHub - brylee10/cache-effects: Benchmarks on performance impact of various processor cache effects · GitHub
- 7.Gallery of Processor Cache Effects
- 10.Improving GPU Performance by Reducing Instruction Cache Misses | NVIDIA Technical Blog